
Census Data Shows Higher Incomes, Slightly Lower Poverty Rate in 2025
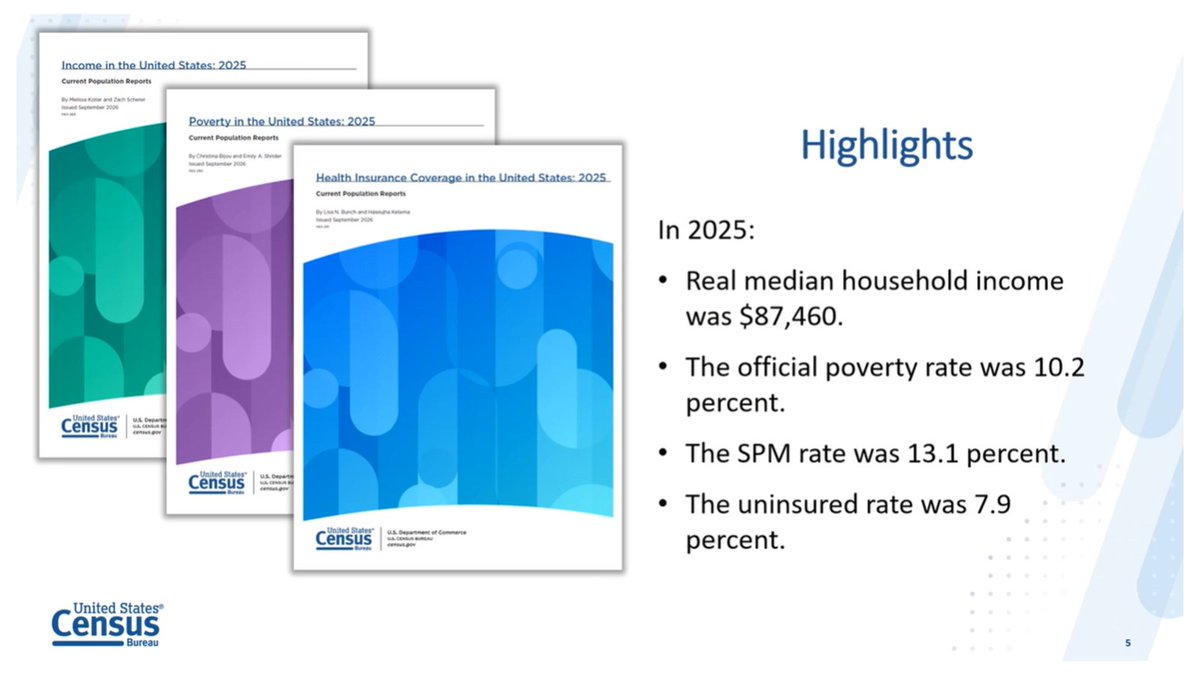
U.S. households saw meaningful gains in income in 2025, while the nation’s official poverty rate declined slightly, according to new data released Tuesday by the U.S. Census Bureau.
Real median household income reached $87,460 last year, a 2.6% increase from 2024 and the highest level recorded since the Census Bureau began collecting the series in 1967. At the same time, the official poverty rate fell by half a percentage point, to 10.2%, with 34.5 million Americans living below the federal poverty threshold.
The Supplemental Poverty Measure, or SPM, which accounts for government benefits such as nutrition assistance and refundable tax credits while also subtracting taxes and expenses such as child care, work-related costs and medical expenses, stood at 13.1% in 2025. That was not statistically different from 2024.
Child poverty fell one percentage point, from 14.4% in 2024 to 13.4% in 2025—the lowest rate on record under the official measure. Under the SPM, the child poverty rate was also 13.4%; traditionally, the SPM has been lower than the official measure.
Medical expenses, meanwhile, pushed 7.7 million people into poverty under the supplemental measure.
The figures are based on the Census Bureau’s Current Population Survey Annual Social and Economic Supplement, the federal government’s primary source for national income and poverty estimates.
Kevin Corinth, Senior Fellow and Deputy Director, Center on Opportunity and Social Mobility at the American Enterprise Institute, posted on X that the data represents “good news. Real median household income increased by 2.6% in 2025, hitting a record high of $87,460. Black households saw even more annual growth of 4.8%. The official poverty rate fell by 0.5 percentage points.”
Amanda Nothaft, director of data and analysis at Poverty Solutions at the University of Michigan, urged caution, however. “The poverty numbers look pretty good – especially child poverty– but these numbers do not reflect cuts in benefits that started to take effect at the start of 2026. These changes will have a large impact on the Supplemental Poverty Measure next year.”
The improvement in household income extended across much of the income distribution. Census officials said income increased significantly at every decile between the 20th and 80th percentiles, as well as at the median and 90th percentile. But income at the 10th percentile—the point below which 10% of households fall—did not change significantly.
“So, what we saw for money income and for post-tax income this year was an increase at the median, an increase at the 90th percentile, and no significant increase at the 10th percentile,” Mike King, chief of the Census Bureau’s Income Statistics Branch, told reporters. “From 20th through 80th, there were significant increases for both pre- and post-tax income.”
The pattern suggests that gains extended well into the middle of the income distribution, although the lowest-income households did not see a statistically significant increase.
The Census Bureau’s new report also includes post-tax income estimates. Median household income after accounting for federal and state income and payroll taxes, as well as tax credits, rose 3.1% to $76,060 in 2025. Post-tax income increased significantly at the median and 90th percentile but, like pretax income, showed no significant change at the 10th percentile.
The official poverty rate declined among working-age adults. The poverty rate for people 65 and older, at 9.8%, was not significantly different from the previous year.
The official poverty rate for Hispanic Americans also reached a record low, falling to 13.9%. Poverty rates for the other racial and ethnic groups highlighted by the Census Bureau did not change significantly.
The gap between the official poverty measure and the SPM was particularly striking for older Americans. While the official poverty rate for people 65 and older was 9.8%, their SPM rate was 15.4%, largely because the supplemental measure counts out-of-pocket medical expenses against household resources.
“The SPM subtracts medical expenses from resources,” John Creamer, lead of the Census Bureau’s Supplemental Poverty Measure team, said in explaining the difference. “A key benefit of the SPM is that it allows us to gauge the effectiveness of tax credits and transfers in alleviating poverty. It also lets us see how necessary expenses can increase poverty.”
The SPM also illustrates the role government programs play in reducing poverty. Census officials estimated that Social Security benefits lifted 28.8 million people above the SPM poverty threshold in 2025, while refundable tax credits lifted another 6.1 million.
"At a moment when the cuts enacted in last year’s harmful Republican reconciliation law have begun to take away food assistance and health coverage from millions of people, today’s Census data are a reminder of the important role Medicaid, Affordable Care Act (ACA) marketplace coverage, and SNAP can play in helping families afford the basics — and why the cuts are so misguided," said Sharon Parrott, president of the Center on Budget and Policy Priorities.
The new data also showed that median earnings for full-time, year-round workers were $66,620 in 2025, not significantly different from 2024. Women’s median earnings increased 3.2%, while men’s earnings did not change significantly, raising the female-to-male earnings ratio to 83.9%.
Health insurance coverage was largely stable. About 26.7 million people, or 7.9% of the population, were uninsured for the entire year, a rate that was not significantly different from 2024. Medicare coverage increased by 0.6 percentage points while Medicaid coverage declined by 0.5 percentage points. Census officials attributed part of the Medicare increase to the growing number of people reaching age 65 and said the Medicaid decline continued the post-pandemic unwinding of enrollment.
State-level income, poverty and health insurance figures will be released separately through the 2025 one-year American Community Survey.